How to read a chromatogram
Peptidkauf Redaktion2 min read
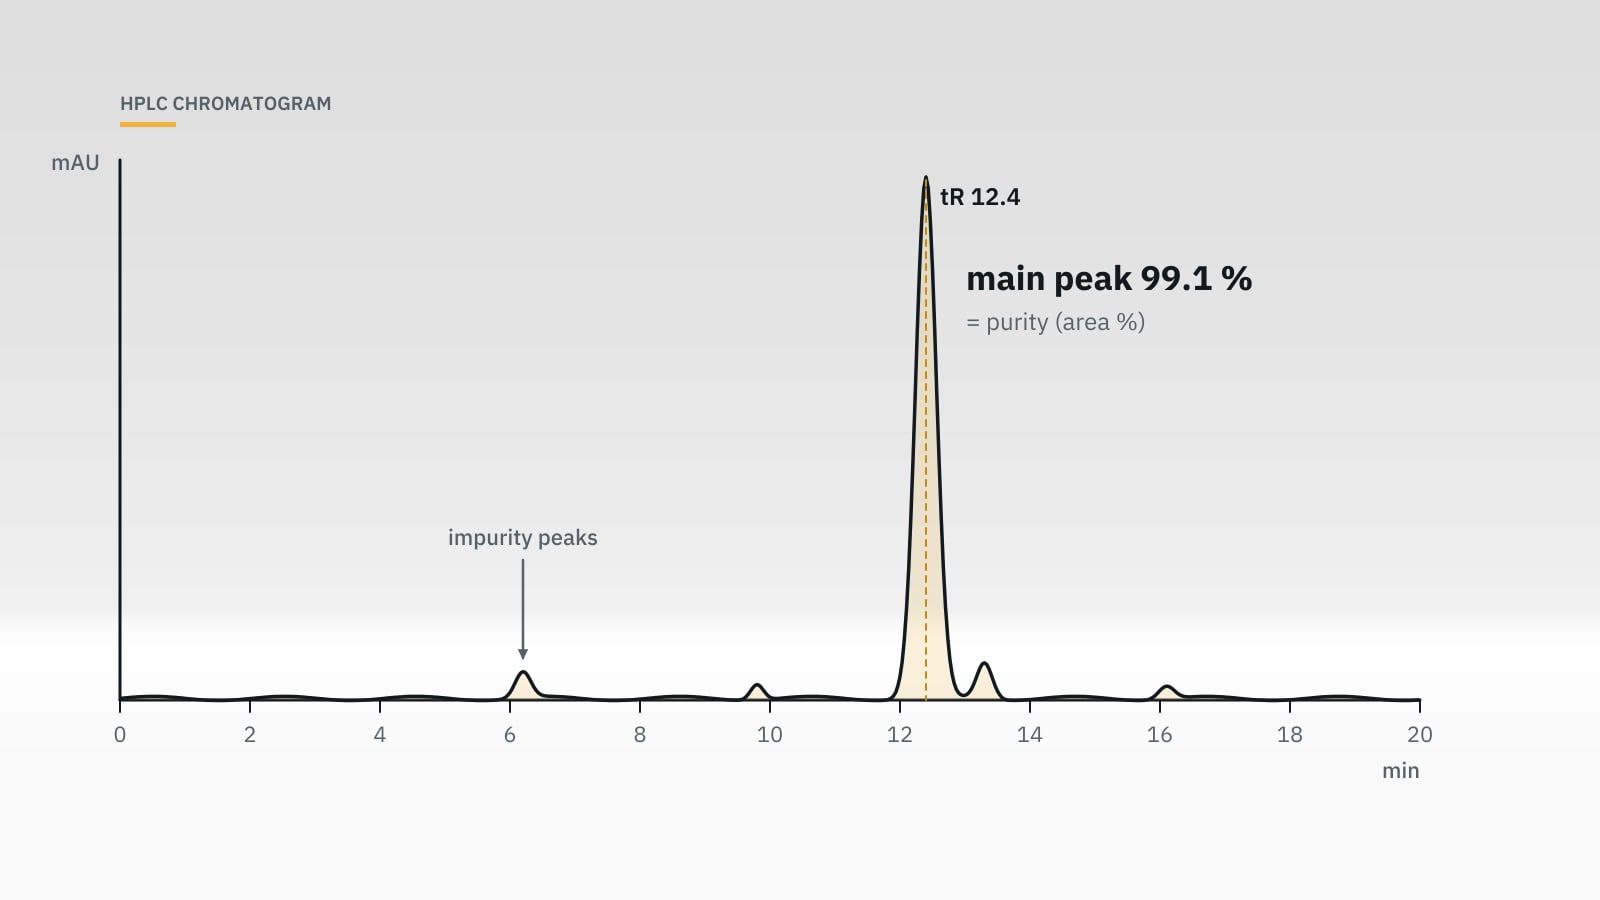
The chromatogram is the heart of many certificates of analysis: the purity percentage is calculated from it. If you can read the graph, you understand where the number comes from and where its limits are. HPLC and mass spectrometry basics are covered on the Quality & analytics page.
What the axes show
The x-axis shows time in minutes since injection. The y-axis shows the detector signal — for peptides usually UV absorbance at 214 or 220 nm. In this range the peptide bond itself absorbs, so practically every peptidic component is visible.
Retention time
Each substance leaves the column after a characteristic time, its retention time. In reversed-phase HPLC (usually C18 columns), polar molecules elute earlier and hydrophobic ones later. Retention time depends heavily on column, gradient and mobile phase, so it is only comparable within the same method and is not proof of identity. Identity is confirmed by mass spectrometry.
Peaks and peak area
A peak is a signal that rises and falls. The area under it is roughly proportional to the amount of substance absorbing at that wavelength. The software integrates all peaks and calculates:
Purity (%) = main peak area ÷ sum of all peak areas × 100
This is an area-percent figure. It assumes all components absorb similarly — a reasonable approximation for closely related deletion sequences.
What to look for
Main peak
A sharp, symmetrical main peak indicates good separation. A broad peak or a "shoulder" may hide an unresolved minor component.
Minor peaks
Small peaks before or after the main peak are typical for synthetic peptides: deletion sequences missing one amino acid, truncated chains, incompletely removed protecting groups or oxidised forms. Their share is already reflected in the purity figure.
Baseline
A calm, flat baseline makes integration easier. Strong noise or drift can mask small peaks.
Early peaks
A signal at the very start often comes from the injection volume or counter-ions such as trifluoroacetic acid and is usually not counted as an impurity.
What the chromatogram does not show
- Water and salts are invisible to the UV detector. 99 % HPLC purity does not mean 99 % of the weighed material is peptide.
- Endotoxins require their own tests.
- Identity only follows from the mass.
See Endotoxin and water content.
Content rather than purity
Some certificates, for example from Janoshik Analytical, also state a measured amount per vial. This assay compares the peak area with a reference standard and answers a different question: how much peptide is actually in the vial? Both values are listed per batch in our lab report archive.
Conclusion
A chromatogram can be read with a few basic terms: retention time, peak area, main peak, minor peaks and baseline. Purity in per cent is an area ratio of UV-visible components. Together with the mass spectrum and the content figure, it gives a complete picture of the batch.